How We Increased Basket Sizes By 20% Using Instacart Stock Up & Save
Every time we onboard a new client, I personally audit their Instacart account—and in most cases, brands are overlooking one of the highest-leverage tactics on the platform.
A tactic that:
- Increases average basket size so even one shopper can achieve your store’s entire sales velocity target
- Makes your listings stand out amongst competitors with a high-visibility badge
- Has zero costs unless it convertsIs highly flexible and easy to iterate on.The tactic is
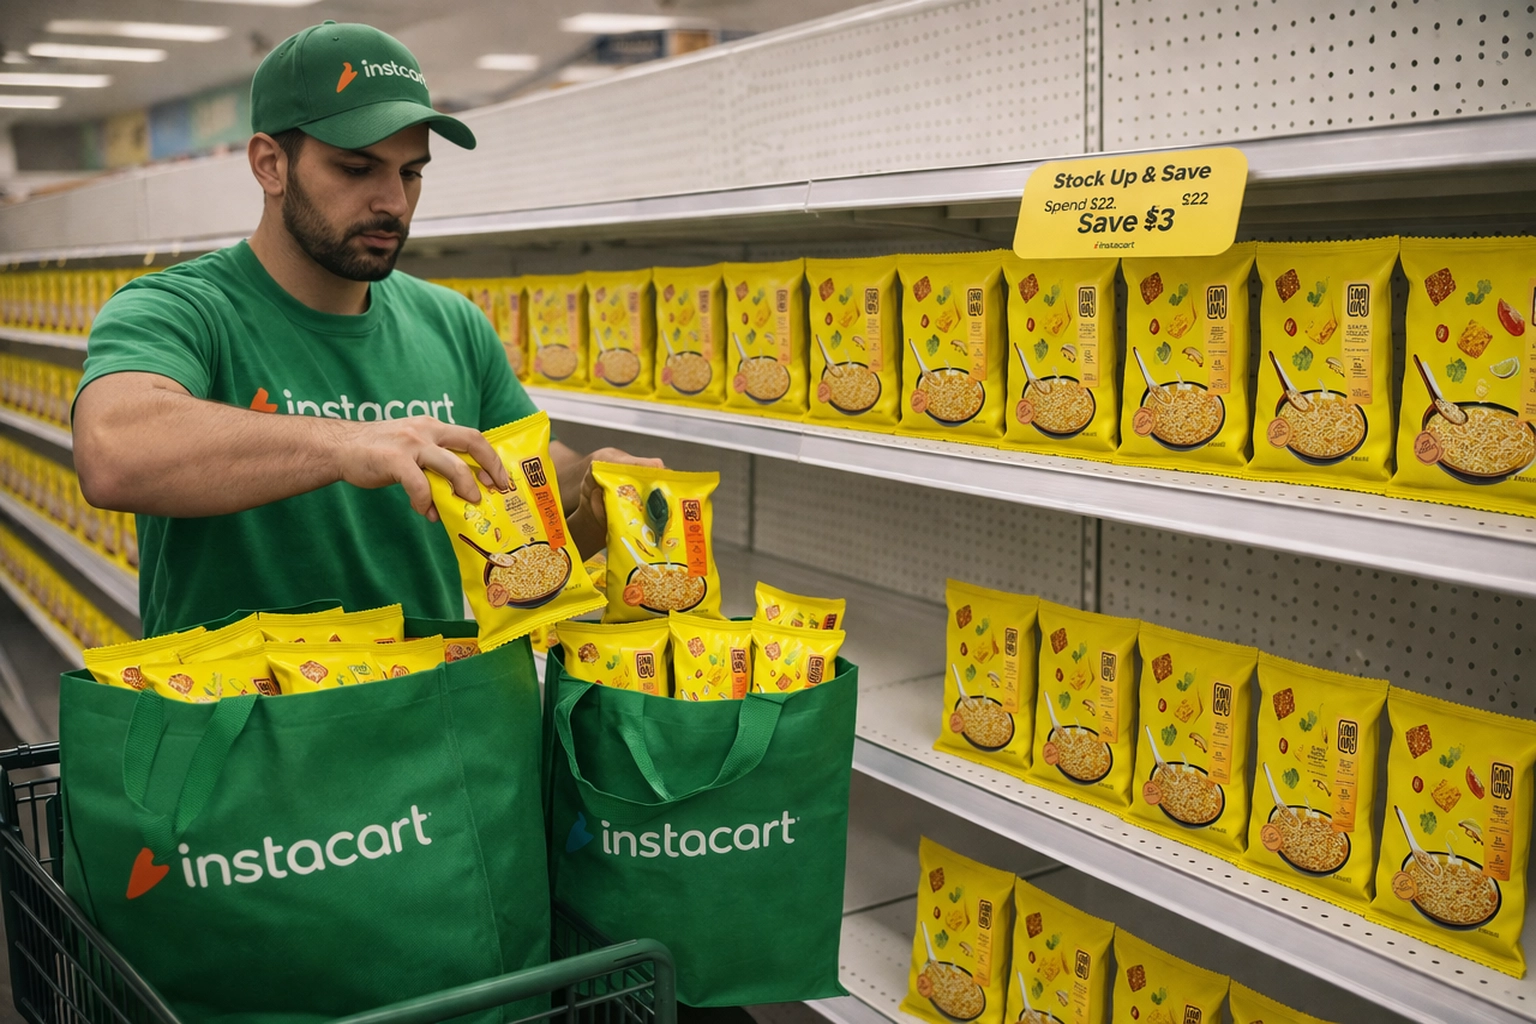
Stock Up & Save (SUAS).
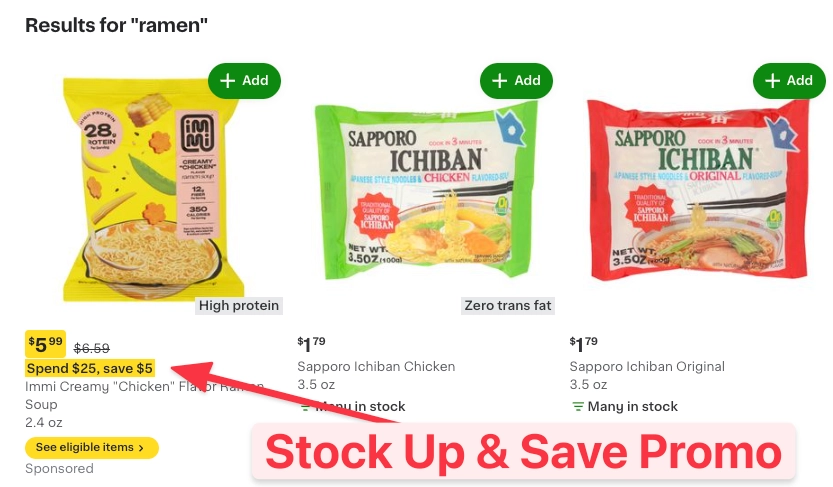
SUAS is designed to drive larger basket by incentivizing shoppers to spend more (Spend $X, Save $Y) and is displayed with a prominent yellow badge on your listing. If a retailer promo is active, it will override the SUAS.
Here’s how we increased the average basket size by
20% for
immi.
Step 1: Determining The Opportunity
We recommend running SUAS for nearly every brand—but before launching, you should quantify the opportunity. There are two key inputs to evaluate:
Evaluate Your Baseline (Basket Size)
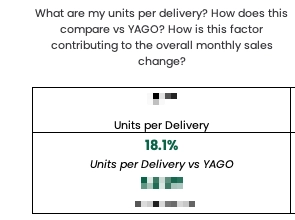
Start by underestanding your current performance using the Sales Decomposition report (Insights Center —> Uploaded —> “ICIP: Sales Decomposition” report).
This report shows:
-Your average units per delivery
- YoY trends
- The contribution of basket size to revenue growth.
This gives you a clear baseline of how much room there is to increase basket size, and how impactful it could be to overall revenue.
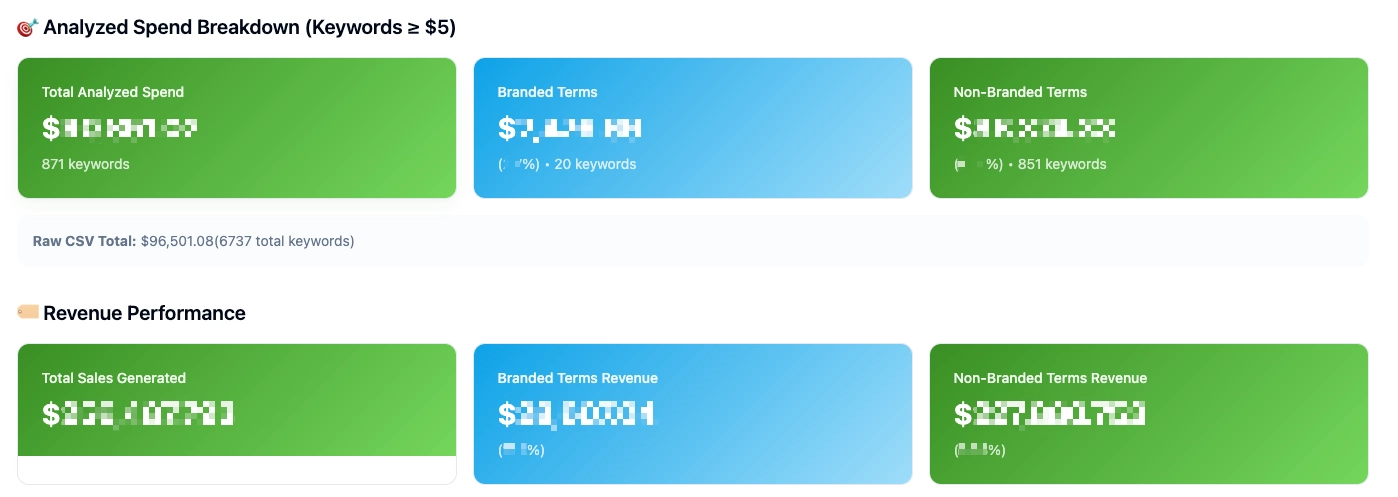
Analyze Brand vs Non-Brand Revenue Mix
Next, determine how much of your revenue is coming from
branded vs. non-branded keywords.
This is critical because it dictates how aggressive your SUAS strategy should be:
-
High branded revenue → higher thresholds. Shoppers already intend to buy your product, so the goal is to -
maximize basket size
-
Lower branded revenue → lower thresholds. New shoppers have less intent, so you need to
reduce friction to drive trial
You can do this by going into your Campaign dashboard —> Click the “Export” button —> All keywords —> Last Touch Attribution. Upload the raw export to our brand vs non-brand analyzer tool
here, plug in your brand name, and analyze the data.
Step 2: Determining The Minimum Redemption Threshold & Savings
The fee per SUAS redemption ranges from $1.50 to $3.25 per redemption.
For a SUAS promo, you’re solving for two variables:
1. Minimum spend threshold (what shoppers need to spend to unlock the offer)
2. Savings amount (what they get once they qualify)
The goal is to increase basket size while staying within your target margin.
Build a simple margin model that includes the: i) redemption fee, ii) product margin %, iii) SRP (price), and iv) savings amount.
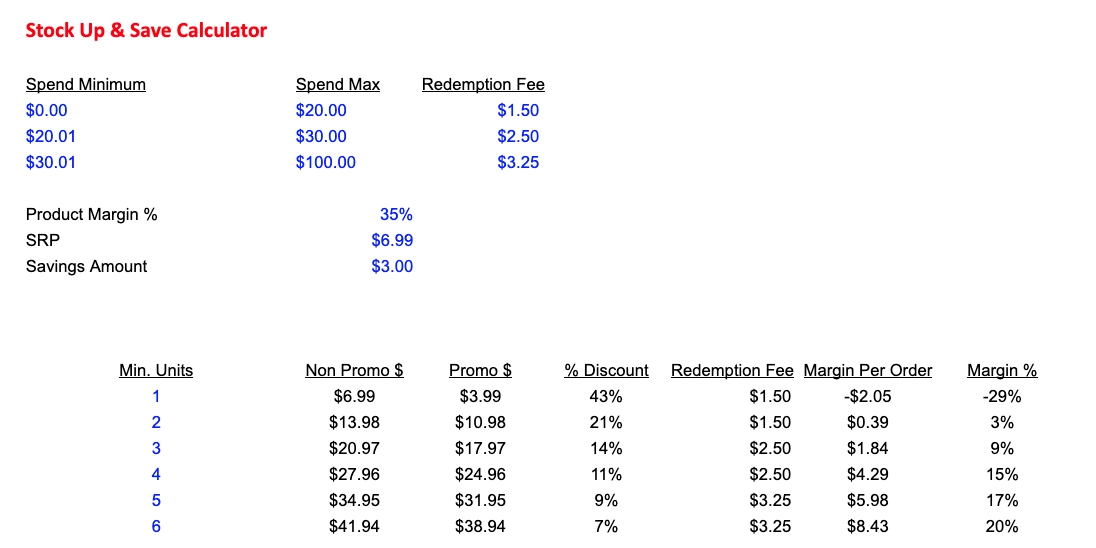
This allows you to simulate different scenarios and understand margin per order at each unit tier, break-even points, and how aggressive you can be on savings. The goal is to identify the minimum unit threshold that still meets your margin target
Our approach is usually to start conservative by offering a lower savings amount to start with and higher minimum thresholds. From there you can always optimize and get more aggressive on the offer once you see real redemption data.
Pro Tip: Since SUAS promos are triggered by a minimum dollar spend (not unit count), you can set the threshold just above the previous unit tier to drive higher basket sizes. For example, if 3 units ≈ $21 and 4 units ≈ $28, set the minimum spend at $22. While it appears like a lower barrier to entry, shoppers will still need to purchase 4 units to qualify—effectively increasing units per order while keeping the promo more psychologically accessible.
Step 3: Set Up & Launch
To launch a SUAS promo, go into Library —> Promotions —> Create Promotion Group —> and select Stock Up & Save.
The goal is to include as many eligible SKUs as possible—prioritizing products that meet or exceed your target margin from Step 2. There’s a strong correlation between # of SKUs in a shopper’s first order and long-term repeat purchase rates. The more products a shopper tries, the higher chance they find a favorite which increases the likelihood of converting them into a repeat, loyal customer.
Don’t just limit SUAS to your hero SKUs, instead use it to drive multi-SKU trial, increase basket diversity, and to cross-sell into other product lines.
Step 4: Analyzing Results & Iterating
The primary metrics you’ll have access to within the dashboard are:
- Redemptions Used: # of total promos that were actually redeemed
- Promotion Sales: Total sales from redeemed orders
- New To Brand Promotion (NTB) Sales: Sales from New-to-Brand shoppers who redeemed
- Sales: Total revenue where the promo was eligible (including shoppers who didn’t redeem).
Note: Sales will often be lower than total platform revenue since not all shoppers are exposed to the promo (eg: retailer promos, or budget constraints)

Based on the above metrics, here’s the type of analysis you’ll want to do:
Avg Basket Size Of Redemptions:
- Formula: Promotion Sales ÷ Redemptions Used
- So What? This tells you how large baskets are when the promo is redeemed
- What you’re looking for: If avg basket size is well above your threshold, you’re underpricing the minimum threshold and you can likely increase it.
New To Brand Promotion Sales %:
- So What? This tells you understand who the promo is attracting (existing shoppers vs new to brand)
- What you’re looking for: If you have high brand keyword searches and have a high minimum threshold, expect lower NTB %. The holy grail is having a high threshold and strong NTB %.
Redemption Rate
- Formula: Promotion Sales ÷ Sales
- So What? This measures how often shoppers are actually redeeming the offer.
- What you’re looking for: You want the highest possible redemption rate within margin constraints. If redemption rates are too low, likely threshold is too high or savings too low.
Item Not Found Rate:
- Path: Go into Insights Centre —> Uploaded —> Item Not Found report.
- So What? As you push higher unit thresholds, you increase the risk of stockouts per order.
- What you’re looking for: If your item not found rate spikes or is rising, you may be pushing basket size beyond available shelf inventory.
Based on the above analysis, use these signals to refine your promo:
- Low redemption rate? Increase savings or lower threshold
- Redemption basket size much larger than minimum threshold? Likely room to increase minimum threshold for better margins
- Low NTB% but high redemption rates? Offer is maximizing basket size of loyal shoppers & shoppers who were likely to purchase regardless
- High NTB% and high redemption rate? This promo should be a priority and should have a dedicated evergreen budget assigned to it
- High item not found rate? Reduce threshold or tighten SKU selection
Key Takeaways
SUAS is not a “set it and forget it” promo, it should be a highly iterative process where you start conservative and optimize based on the results until you find the sweet spot between basket size, redemption rate, and margins. When done right, a single shopper can meaningfully contribute to store velocity, making Instacart disproportionally valuable despite the platform representing a smaller share of total shoppers.


